问题标题
如何设置vchart柱状图的x,y轴文字和柱状大小?
问题描述
我在使用vchart柱状图时,想要设置x,y轴的文字大小和柱状大小,但是在文档中没有找到相应的配置项。我试了一些参数,但是都没有成功。请问应该如何设置?
解决方案
vchart柱状图的x,y轴文字大小和柱状大小的设置,都可以通过轴 label 的 style 字段进行配置。同时,柱状大小的设置可以通过调整柱状图的宽度来实现。
示例代码
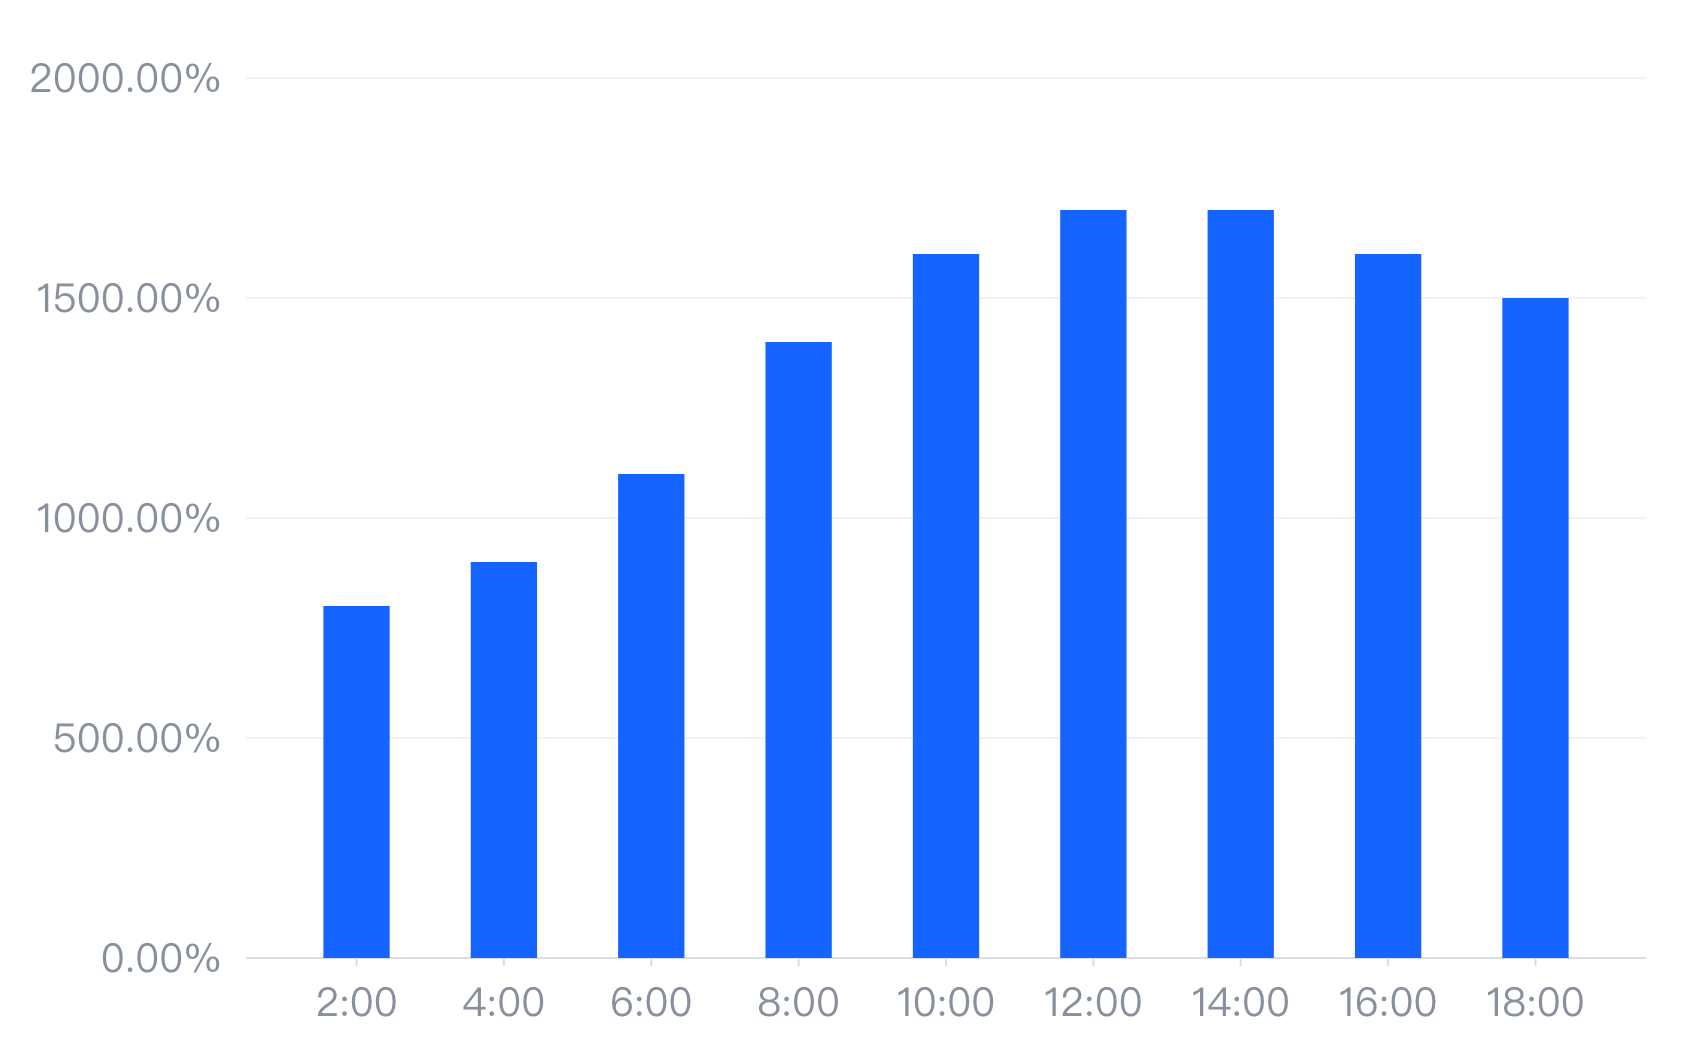
const spec = {*
*  type: 'bar',*
*  data: {*
*    values: [*
*      {*
*        time: '2:00',*
*        value: 8*
*      },*
*      {*
*        time: '4:00',*
*        value: 9*
*      },*
*      {*
*        time: '6:00',*
*        value: 11*
*      },*
*      {*
*        time: '8:00',*
*        value: 14*
*      },*
*      {*
*        time: '10:00',*
*        value: 16*
*      },*
*      {*
*        time: '12:00',*
*        value: 17*
*      },*
*      {*
*        time: '14:00',*
*        value: 17*
*      },*
*      {*
*        time: '16:00',*
*        value: 16*
*      },*
*      {*
*        time: '18:00',*
*        value: 15*
*      }*
*    ]*
*  },*
*  barWidth: '50%',*
*  barMinWidth: 20,*
*  barMaxWidth: 50,*
*  xField: 'time',*
*  yField: 'value',*
*  axes: [*
*    {*
*      orient: 'left',*
*      label: {*
*        formatMethod(val) {*
*          return `${(val * 100).toFixed(2)}%`;*
*        },*
*        style: { fontSize: 20 }*
*      }*
*    },*
*    { orient: 'bottom', label: { style: { fontSize: 20 } } }*
*  ]*
*};*

*const vchart = new VChart(spec, { dom: CONTAINER_ID });*
*vchart.renderSync();*

*// Just for the convenience of console debugging, DO NOT COPY!*
*window['vchart'] = vchart;</br>
结果展示